
Provided by Dr. Nuttapol Rittayamai
Case Synopsis
A 59 years old man presented with COVID-19 pneumonia and severe ARDS. He was ventilated, heavily sedated and paralyzed, and received prone positioning for two consecutive weeks. After discontinuing cisatracurium, he developed asynchrony with the mode Pressure Regulated Volume Control (PRVC). We decided to put an EAdi catheter to evaluate his neural drive and to promote synchronization using the mode Neurally Adjusted Ventilatory Assist (NAVA). Interestingly, his EAdi was very high (varying from60-80 uV) even when receiving high doses of midazolam, fentanyl, and thiopental because of his agitation. His arterial blood gas did not show significant acidosis or CO2 retention to explain such a high EAdi.
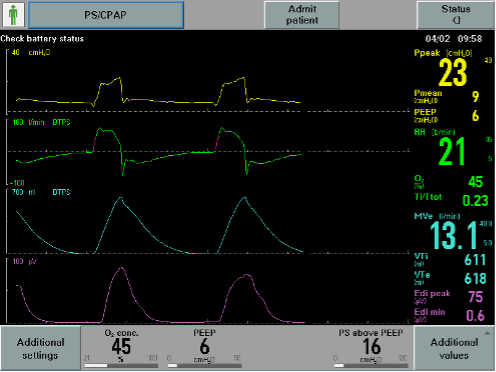
Airway pressure delivered was limited during NAVA mode to avoid too high pressure support due to high level of EAdi (Figure 1 – square airway pressure waveform). We thought that NAVA was not a good mode of choice in this case then, to promote weaning, we decided to switch him to PSV mode and gradually decreased the level of pressure support (PS) regardless of the absolute EAdi value (Figure 2).

We found a slight increase in EAdi after switching from NAVA to PSV (Figure 3), however, his breathing pattern was stable. We collected data on P0.1 in both modes, but due to the questionable reliability of P0.1 to represent respiratory drive during NAVA (because the trigger is neurally based rather than flow or pressure), we provide the P0.1 trend during PSV (Figure 4).


Pmusc index (PMI), the pressure generated by the inspiratory muscles which represents inspiratory effort during PSV and calculated as occlusion plateau pressure minus airway pressure before occlusion, was measured at PS of 16 and 8 cmH2O and we found no difference in PMI between the two levels of PS (6 and 7 cmH2O, respectively) (Figure 5 and 6).


Finally, because of the acceptable level of PMI, the ventilator was successfully disconnected and high-flow oxygen via tracheostomy mask was applied after 4 days of weaning with PSV, despite an excessive level of EAdi.
For more information on PMI measurements please see our previous post here.
Further Reading on PMI
Foti G, Cereda M, Banfi G, Pelosi P, Fumagalli R, Pesenti A. End-inspiratory airway occlusion: a method to assess the pressure developed by inspiratory muscles in patients with acute lung injury undergoing pressure support. Am J Respir Crit Care Med. 1997;156(4 Pt 1):1210-1216.
This is something that seems to be common in patients with ARDS/COVID related ARDS once the paralytic is discontinued and sedation is being lightened. Many patients we’ve observed have very high Edi and are only satiated when the pressure regulation that you folks used is lifted and the patient begins receiving much higher than goal tidal volumes (sometimes up to 10-15ml/kg PBW-even with very low inspiratory pressures when using conventional modes like PS). Obviously, we don’t think this is helpful and often use the pressure regulation option in NAVA as well.
Another interesting thing we’ve noted is that as the patient becomes less encephalopathic, the Edi also lowers. Is this because lung function is improving over time or does it have something to do with the encephalopathy? We also monitor P0.1 and recently began looking at PMI.
As far as PMI, as I’m still learning, is there a direct correlation between PMI and Pmusc? So say if PMI is 7, Pmusc is estimated to be 7? And is PMI more accurate with excessive effort than it is with normal to slightly elevated effort?
Thanks in advance, great case presentation
To answer the question about PMI and Pmus relationship. The Foti reference above looked at this. PMI and Pmus at end inspiration was correlated r = 0.93, p < 0.01.
Hello, regarding the case, I would like to know if they had any estimation of the Vd/vt that could explain such a drive, or if it had signs of organizing pneumonia in the radiological controls. In addition, it is adequate to tolerate levels of PD greater than 15? since this patient in psv mode had over 20 cmh3o of dp Thanks a lot
Unfortunately, no further information was provided for this case example.
Firstly, thank you for a great post.
It might be a little off topic, but I would like to know your (and actually anybody who reads this post) take on driving pressure in these patients.
If I am doing mu calculations correctly then the driving pressure in this patient is very high (29-6 = 23 cmH2O –> 25-6 = 19 cmH2O). Is it something that you follow and try to correct during pressure support ventilation?
I think it’s safe to say that we don’t know if the harms of sedation/paralysis are better or worse than allowing a high driving pressure during pressure. Further data is needed.